
By Russ Unger, Chief Experience Officer; Brad Nunnally, Senior Director of User Experience; and Steve Fultz, Associate Director of Experience Design
Read Part 1 and Part 2 in our Applying a Flexible Discovery Process Series
Following the Rapid Prototyping phase in our Discovery sprint, we were aligned on our epics and user stories, as well as the high-level visual direction of the application. We had prototyped our first scenario, which included the initial dashboard for an analyst. We had partnered with our user to explore the most appropriate and useful interactions on the Dashboard. This process provided insight into how we would design the screens for the rest of our prototype scenarios. We created a narrative that highlights the user experience of exposing granular, detailed data from aggregated summary information. This narrative set us up to deliver our final prototype concept to the customer, which we’ll explore in this final article in our 3-part series on the Flexible Discovery Process.
Discovery Conclusion & Prototype Delivery
After we completed our research and co-design sessions, we built a no-code, interactive prototype using Figma. We created a narrative that guided our customer through a detailed walk-through of scenarios an analyst might encounter while using the application. We started with the Dashboard and detailed each section to highlight the various contexts an analyst could use the application to investigate the readiness of different teams across the organization. For the purposes of this article, we’ll focus on the narratives of the Dashboard and the Training Readiness sections.
System-wide Readiness Reporting Dashboard
The System-wide Readiness Reporting Dashboard was created with analyst customization in mind – that is, we created an initial view of the dashboard for our analyst user. We worked with the understanding that different analysts would have different areas of focus, and thus their readiness needs would be different, as well.
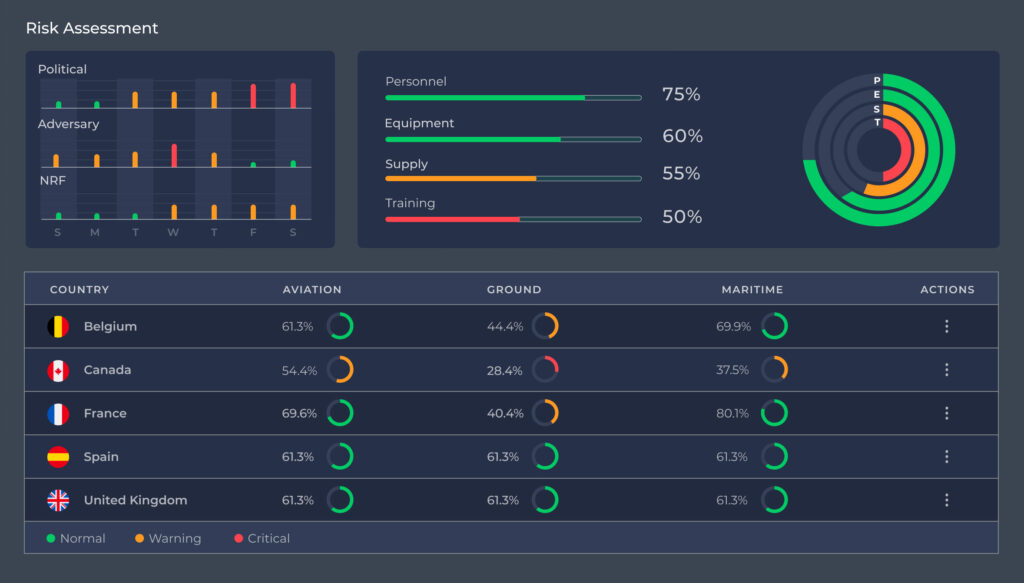
The analyst’s dashboard initially displays political, adversary, and task force risk trends for the previous week, followed by the overall readiness across the organization through the defined metrics of personnel, equipment, supply, and training. This, at a cursory glance, provides enough information to determine if there’s a need to explore further or take additional action across the network.
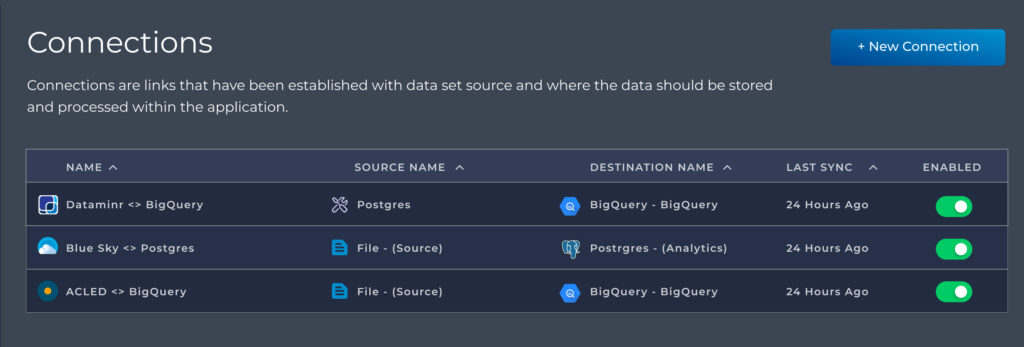
On the map below first row, the analyst can review a high-level, tracking of blue force and red force based upon pre-selected datasets and customized based upon the parameters set in the analyst’s indications and warning matrix. The datasets selected are from an internal “data store” where analysts can pick and choose from available sources as needed, while also importing their own data—from subscriptions, network, or local sources, to surface the most meaningful information.
The map is interactive, allowing an analyst to zoom in or navigate to different parts of the region, which updates the various readiness details displayed. Everything displayed in the prototype is notional and not real-time nor actual data in this example.
The final portion of the dashboard displays a trend analysis of red force cyber activity. This example shows cyber activity based upon malware events happening to the energy and power grids, over time. Spikes in activity can be compared against various datasets to provide insight that can lead to enhanced situational awareness and enhanced decision making.
Training Readiness & Detailed Data Views
The Training Readiness view provides an overview of the upcoming training activities taking place within the scope of the specific geographical location. Within the scrollable view, there’s an upcoming Cold Response training happening in Norway which an analyst needs to ensure all nations that will be attending have the personnel available, the required equipment, the ability to get supplies, and all prerequisites training has been completed. The analyst can select the Cold Response training to see more details about the event, its location, which teams are participating in the training, and their overall readiness.
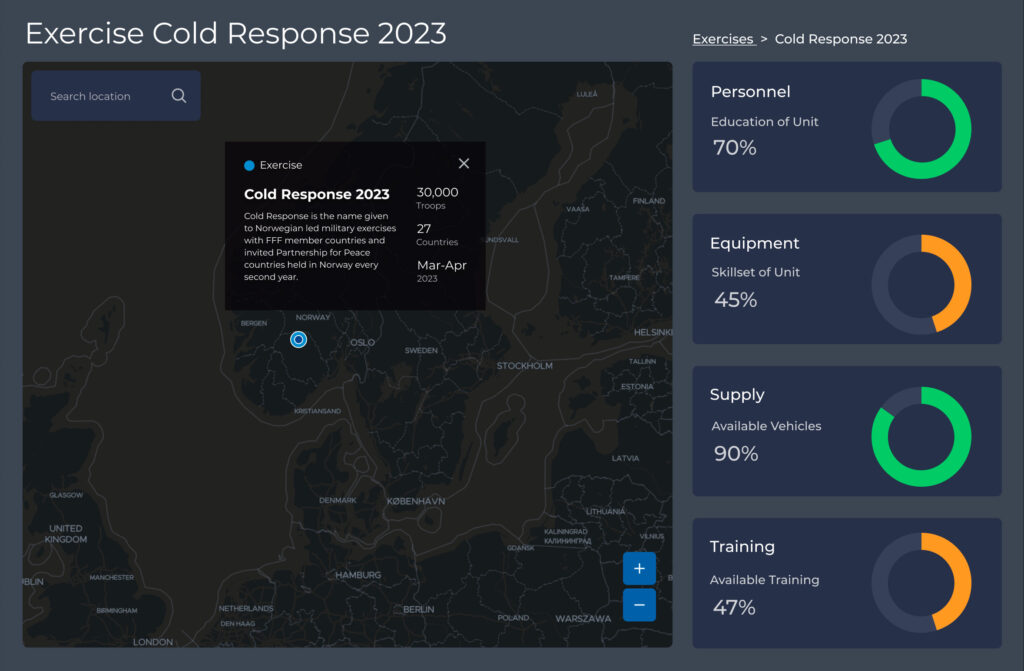
The analyst can determine the cumulative readiness for the participating teams at the personnel, equipment, supply, and training levels. They can also drill down to get more detailed information about each specific team and continue to the individual team member level. The summary view allows the analyst to have an at-a-glance view of readiness that helps them determine the necessary action to take.
The analyst notices that the readiness for Germany’s team appears to be lower than what is expected for the training and requires additional context to inform a plan of action. By selecting Germany from the list, the system expands to display 4 total teams assigned to the cold training, along with their cumulative readiness levels.
Observably, Task Group 2 has a lower overall readiness than the others. When the analyst selects Task Group 2, the system expands and displaying the 4 task units assigned to this Task Group. Task Unit 21 has the lowest overall readiness and the analyst expands the task unit to show all 10 team members, with Team Member 4 showing 0% readiness.
The analyst is able to obtain additional information supplied by the Task Group Team Lead that states that the position is open and has been posted for recruitment. This allows the analyst to make an informed decision about what action to take, if any, in order to support improving the readiness of the participating country prior to the training activity.
We prototyped the ability to take a deep dive into the data to represent the series of questions an analyst would typically ask themselves:
- Why is this readiness rating so low?
- Which Task Group is in a state of risk?
- Is there a particular Task Unit that is impacting the overall readiness score?
- Is there a Team Member who is not prepared for the training and is bringing the score down?
- Do I need to take an action to remove / replace / onboard a team member for the training?
- What steps should I take next now that I understand what’s happening with the readiness scores?
Our goal was to provide analysts with the ability to quickly get to details in their data, while also reaching an informed course of action. We shared this with our customer to their surprise and delight. We had presented a path to the “art of the possible” that showed them a path forward through a current and significant challenge.
Discovery Provides Informed Possibilities
For this 10-day effort, we used a condensed approach to Discovery, which meant rapidly moving toward a completion that was fine-tuned and detailed in at least one scenario (Training Readiness), while showcasing other areas of opportunity at high-level. Additional time to conduct Discovery would allow for more access to stakeholders and users, which in turn would allow for a more rigorous and investigative approach. This would have allowed for a prototype with more thoroughly explored and defined features and functionality within the application.
By designing multiple aspects of readiness, we allowed the customer to focus on their own priorities, while presenting a vision of how readiness data could be used as a reporting and action-taking mechanism. We explored a scenario where team members could self-report their own readiness data through a mobile application, which would result in real-time data being reported.
We use Discovery to help our customers deeply understand their challenges and problems, with a roadmap for future delivery, so that they can make informed decisions about the investments in their next steps for solution delivery.
We’re ready to help you.